Sometimes we need some intelligence on how our deploys have behaved. We ask ourselves questions like:
- How many deploys have we done this month, or this quarter?
- How many have failed?
- How many rollbacks have we done?
- What was the context of that deploy that failed on march 29th?
So I came up with this idea to store the deployment information using the Elastic search, Logstash, Kibana stack. It is quite nice because it is free to use and it is very powerfull and customisable.
In addition I’d like to use queues to store the deploy information because I’d like to have a local SLA in case I do deploys in more than one geo location. In that case the messages are copied from one server to another with a shovel operation. In this example I will be using rabbitmq, but keep in mind that you can use other connectors with logstash. (files, tcp and so on)
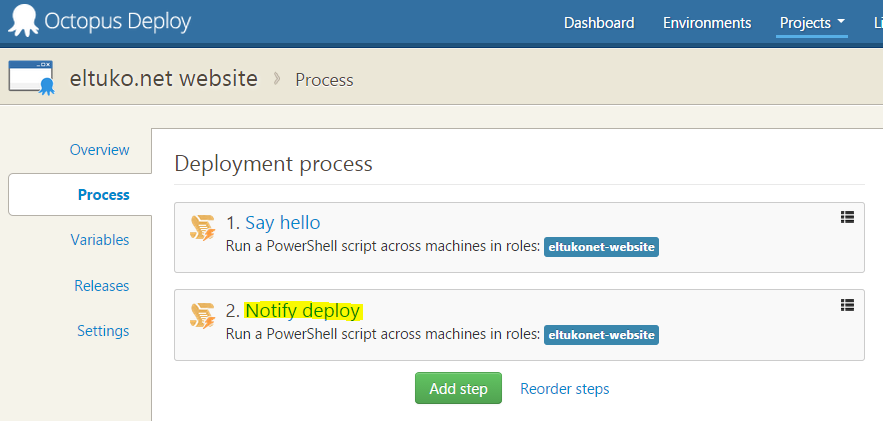
To achieve this I would start with defining a the steps of a simple process:
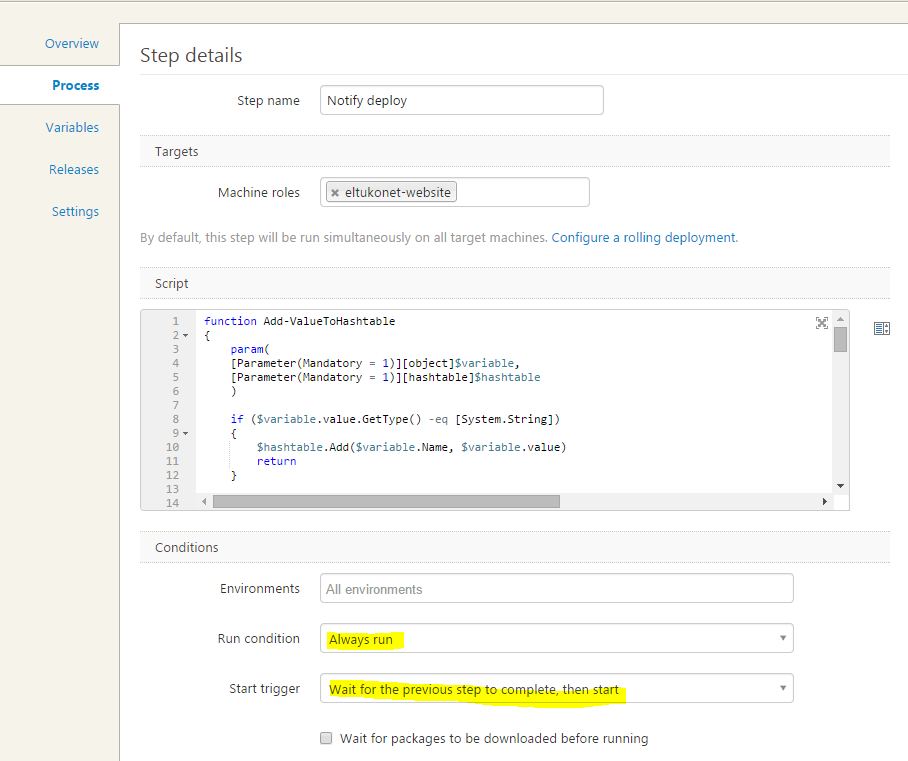
Let’s look the notify deploy step in the eyes:
I tell the step to always run (so that failed deploys will be notified as well) and to run only when the rest of the steps have been already completed. The piece of code that has to be pasted in the powershell script window is explained soon:
$json = Get-OctopusVariablesJson | ConvertTo-AsciiString
$body = New-Object PsObject -Property @{ properties = @{}; routing_key = "#"; payload = $json; payload_encoding = "string" } | ConvertTo-Json -Compress

$securepassword = ConvertTo-SecureString $rabbitPassword -AsPlainText -Force
$cred = New-Object System.Management.Automation.PSCredential ($rabbitUsername, $securepassword)

Invoke-RestMethod -Uri "$rabbitUrl/api/exchanges/$rabbitVirtualHost/$rabbitExchange/publish" -Method Post -Credential $cred -Body $body -ContentType "application/json"
In this code sample
- I fetch all octopus variables in a string in json format
- create a body to post to rabbitmq http api
- do a http post to the rabbitmq api
In this case it was easier for me to do so because I didn’t want to import external libraries to talk to rabbitmq.
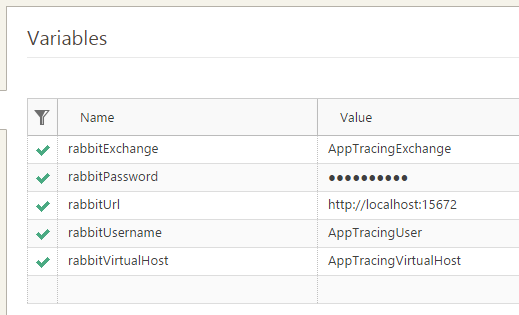
I store the credential and endpoint variables in Octopus because it is handy in case they change in future and because the password variables can be encrypted in Octopus deploy.
Here is a screenshot of the variables:
Of course you will need the Get-OctopusVariablesJson method to get the good stuff, you can find it at the bottom of the code snippet
function Add-ValueToHashtable
{
    param(
    [Parameter(Mandatory = 1)][object]$variable,
    [Parameter(Mandatory = 1)][hashtable]$hashtable
    )

    if ($variable.value.GetType() -eq [System.String])
    {
        $hashtable.Add($variable.Name, $variable.value)
        return
    }

    if (($variable.value.GetType() -eq (New-Object 'System.Collections.Generic.Dictionary[String,String]').GetType()) -or ($variable.value.GetType() -eq [Hashtable]))
    {
        foreach ($element in $variable.Value.GetEnumerator())
        {
            $obj = New-Object PsObject -Property @{ Name = $element.Key; Value = $element.Value }
            Add-ValueToHashtable -variable $obj -hashtable $hashtable
        }
        return
    }

    throw "Add-ValueToHashtable method does not know what to do with type " + $variable.value.GetType().Name
}

function Get-UnixDate
{
    $epoch = Get-Date -Year 1970 -Month 1 -Day 1 -Hour 0 -Minute 0 -Second 0
    $now = Get-Date
    return ([math]::truncate($now.ToUniversalTime().Subtract($epoch).TotalMilliSeconds))
}

function Get-IsRollback
{
    $currentVersion = New-Object -TypeName System.Version -ArgumentList $OctopusReleaseNumber
    $prevVersion = New-Object -TypeName System.Version -ArgumentList $OctopusReleasePreviousNumber

    return ($currentVersion.CompareTo($prevVersion) -lt 0)
}

function Get-OctopusVariablesJson
{
    $octoVariables = @{}

    foreach ($var in (Get-Variable -Name OctopusParameters*))
    {
        $ansivalue = Add-ValueToHashtable -variable $var -hashtable $octoVariables
    }

    $octoVariables.Add("isrollback", (Get-IsRollback))
    $octoVariables.Add("timestamp", (Get-UnixDate))
    $octoVariables.Add("safeprojectname", $OctopusParameters["Octopus.Project.Name"].Replace(" ", "_"))

    return ($octoVariables | ConvertTo-Json -Compress)
}

function ConvertTo-AsciiString
{
    param(
    [Parameter(Mandatory = $true, ValueFromPipeline = $true, ValueFromPipelineByPropertyName = $true)]
    [string]$input)

    process {
        #custom desired transformation
        $tmp = $input.Replace("ì", "i")
        #fallback
        $bytes = [System.Text.Encoding]::UTF8.GetBytes($tmp)
        $asciiArray = [System.Text.Encoding]::Convert([System.Text.Encoding]::UTF8, [System.Text.Encoding]::ASCII, $bytes)
        $ascistring = [System.Text.Encoding]::ASCII.GetString($asciiArray)
        return $ascistring
    }
}
As you can see I did some customizations:
- I added a safeprojectname variable because I like to write easy queries later in kibana
- I added the timestamp in a Unix format because it is the format I will read later on with logstash
- I wrote a custom variable to tell me define if it is a rollback or not (I just assume that if I go back to a lower version it is)
- with the ConvertTo-AsciiString function I just get the values in an ansii format in case there are special characters I don’t want to deal with later on. (the http post to rabbitmq was not working well otherwise)
As you can see the code is not perfect but it should do the trick. (my goal here is to illustrate a potentiality) If you care about variable encryption please take care of that as well.
In your logstash configuration you will have to read from your rabbitmq server:
input {
 rabbitmq {
 host => "localhost"
 vhost => "AppTracingVirtualHost"
 exchange => "AppTracingExchange"
 queue => "AppTracingQueue"
 key => "#"
 durable => true
 type => "logs"
 user => "AppTracingUser"
 password => "AppTracingPassword"
 }
}

output {
 elasticsearch {
 host => "localhost"
 index => "%{type}-%{+YYYY.MM.dd}"
 cluster => "customelasticclustername"
 }
}

filter {
 if [type] == "logs" {
   date {
     match => [ "timestamp", "UNIX_MS" ]
   }
 }
}
In this case your elk server will read from a rabbitmq queue, and then it will store it on elastic search. The filter is needed here to store the timestamp of a deploy entry in the correct format.
Now that the information is avaiable in elastic search, we can create some nice Kibana dashboard. This is actually a fun part because it is here that you start answering the questions that we asked ourselves at the start of this post.
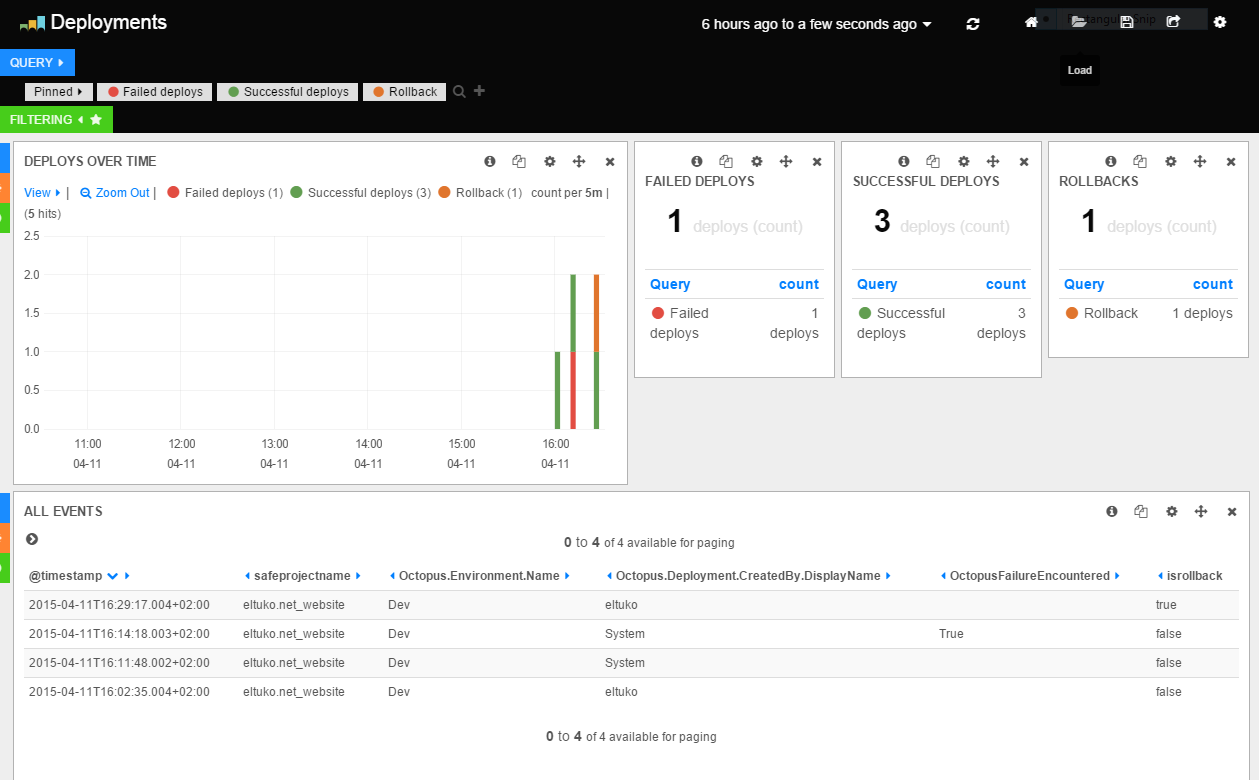
In the next screenshot you can see that the dashboard almost answers all our questions immediately:
If you change the timeselection all the dashboard will adapt to the new selected timerange.
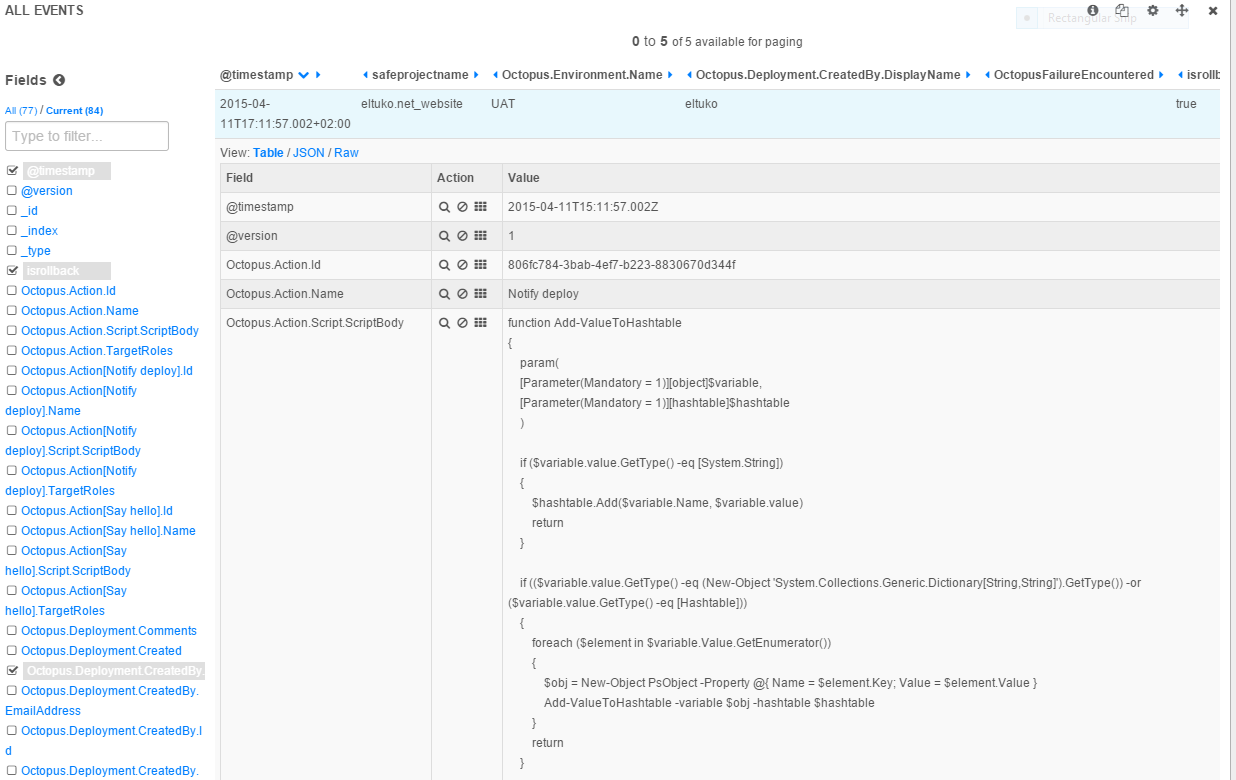
If you want you can check the information of a specif deploy just by expanding the info associated to a log event:
In this case you’ve hundreds of attributes, you cannot see them all on the screenshot. With this we answer our final question. (What was the context of that deploy that failed on a specific day)
Conclusion:
It’s a lot of work to setup such a system from scratch, but for some of you out there it might be a good idea especially if you’ve to answer some questions you ask yourself or that your business asks you. The code or the solution isn’t perfect but it might tease your fantasy. I hope you enjoyed the idea :)

Any chance this could be published as a step template – https://library.octopusdeploy.com?
Would be great for the community to have easy access to this.
Hi Matt!
I’ve been busy but I finally managed to add the step template in the Octopus Library and to create the pull request.
You can track it here:
https://github.com/OctopusDeploy/Library/pull/181
I’m just curious: Are you tracking deploys with ELK or Splunk somehow?
What if you wanted to bypass rabbitmq and send deploy info directly into logstash? Also, what would be a good way to mask sensitive variables?
Hi Steve!
Logstash will always have to read from a source somehow so that it can write it to a destination. You can get a list of input plugins here .
If you are on a local network you could use a tcp filter. Please check this link.
I don’t know what would be best for the sensitive variables. The simplest thing that I can think of would be to override the values at the end of Get-OctopusVariablesJson function, but to do this we need to know if a variable is sensible or not …
I see you don’t monetize your website, don’t waste your traffic, you can earn additional bucks every month because you’ve got hi quality content.
If you want to know how to make extra money, search for: Boorfe’s tips best adsense alternative
Really nice approach, i am planning to do this, and also send Jenkins and Github telemetry to ELK stack, just to close the loop of my deployment pipeline.
Useful links:
Github -> ELK
https://help.github.com/enterprise/2.12/admin/articles/log-forwarding/
Jenkins -> ELK
http://www.admintome.com/blog/logging-jenkins-jobs-using-elasticsearch-and-kibana/
Glad you like it, I’ve also found this post if you want to play with Octopus data: https://octopus.com/docs/administration/reporting
I am working on ELK framework for logging. I want to deploy logstash through octopus and and want to fectch value of username and password from octopus.
Please find below my config file
input {
couchdb_changes {
db => ****
host => *****
secure => ****
username => test
password => “test123” //couchdb password
port => 6984
sequence_path => “seq_path” //sequence path
tags => “proadmin_logs_dev_env”
}
}
filter {
}
output {
elasticsearch {
hosts => “*” //elastic search cluster url
ssl => “true” //connection with https
index => “index_-%{+YYYY.MM}” //elasticserach index name
codec => “json”
document_type => “tesrt” //elasticsearch index type
manage_template => false
}
}